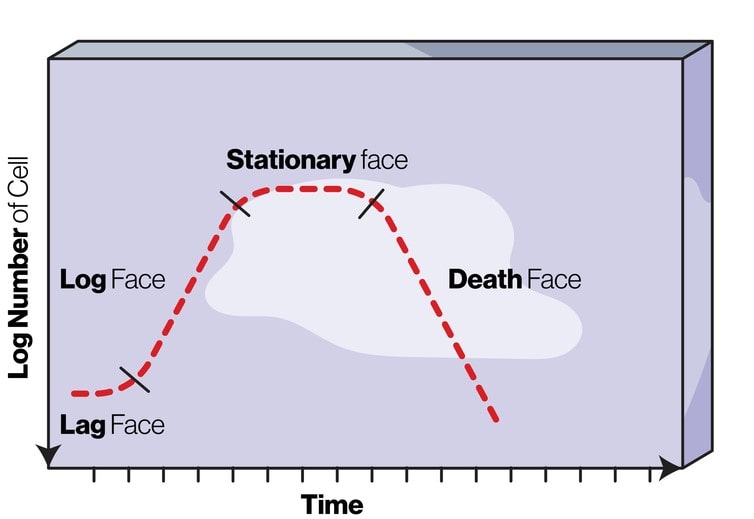
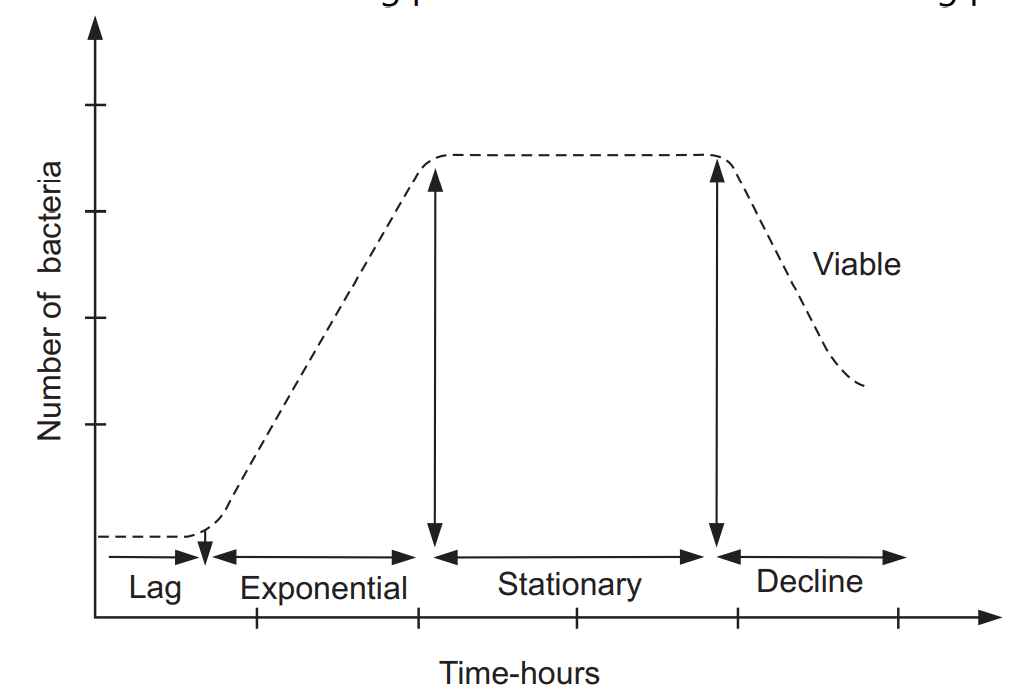
The bacterial growth curve has four distinct phases viz. Lag phase, Log phase, Stationary phase, and Decline phase. (Fig1 )
Table of Contents
Lag Phase:
The bacteria first undergo a period of acclimatization when they are inoculated into the sterile nutrient medium. During that time, necessary enzymes and intermediate metabolites are synthesized and before multiplication, the bacterium reaches a critical stage and finally, multiplication takes place at this stage. Hence, this stage is also known as an initial stage or dormant stage. The duration of this phase depends on the type of bacteria, quality of culture medium, size of the inoculum, and some environmental factors like CO2, temperature, pH, etc. The average time of the lag phase is 2 hours but it varies from species to species and ranges between 1-4 hours.
Log Phase:
After the Lag phase, the next phase is the Log phase. In this phase, the bacteria undergo cell division, and their population increases exponentially at a logarithmic rate. Hence this phase is also known as the exponential phase. The number of the viable count, when plotted against the time it gives a straight line of inclined fashion. The average time of the log phase is 8 hours but also varies with the bacterial species.
Stationary Phase:
In this phase, the cell division of bacteria is almost ceasing due to the exhaustion of nutrients and also the accumulation of toxic products. Secondary metabolites like antibiotics are also produced in this phase. Cell death starts at a slow rate and is compensated by the formation of the new cell through cell division. The total cell number increases at a slow rate, but the viable count remains almost constant. The duration of this phase varies from a few days to a few hours.
Decline Phase:
This is the last stage of the bacterial growth cycle. In the phase of decline, the total number of cells remains constant, but the number of viable cells gradually decreases due to the exhaustion of nutrients and also the accumulation of toxic products. In some cases, a few cells remain viable for a long time. These viable cells probably grow by utilizing nutrients released from dead cells. The cells attain maximum size at the end of the lag phase and become smaller in the log phase.
Make sure you also check our other amazing Article on : Culture media