A phase diagram is a plot describing conditions of temperature and pressure under which two or more physical states coexist in dynamic equilibrium. Critical Solution Temperature means phase diagram is a graphical representation of chemical equilibrium. This diagram is also called as Pressure – Temperature graph.
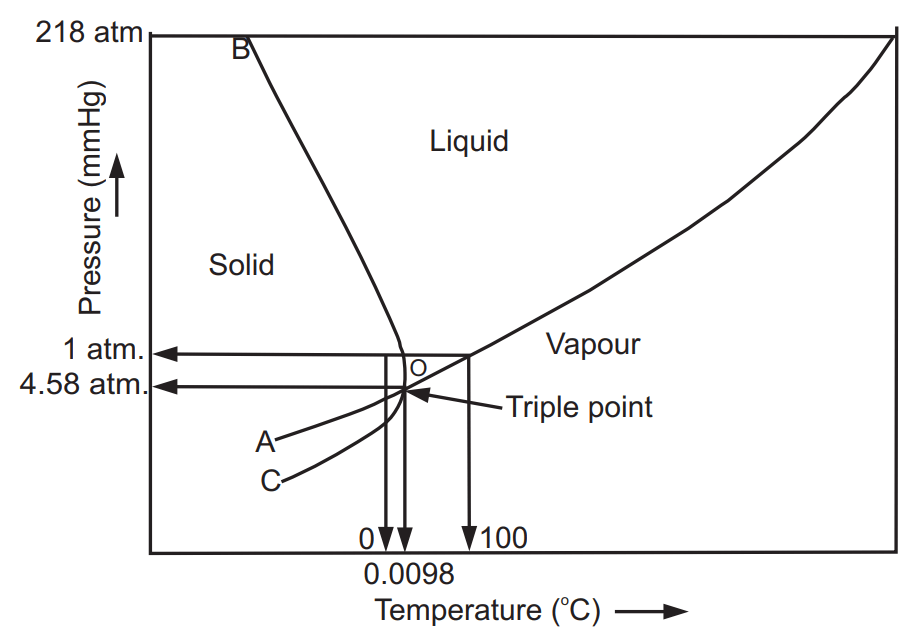
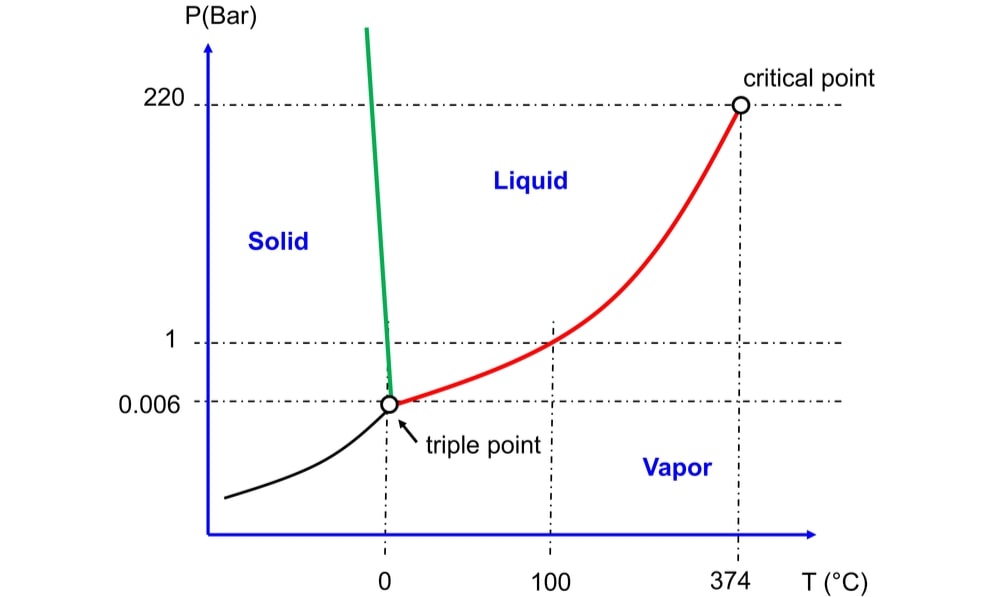
In the phase diagram of water, there are three lines or curves that separate the area of each phase. Adjacent to each line there exists a different single phase of water. At any point on line there exist equilibrium between two phases shown by area i.e. solid/liquid, liquid/vapour and solid/vapour. The line OA, OB and OC represent equilibrium between liquid and vapour, solid and liquid and solid and vapour phases, respectively. The line OA represents the vapourization curve and OC represents the sublimation curve. For example, above line OA the liquid water exists and below it, water vapour exists. The liquid-vapour equilibrium curve has a top limit labelled as C in the phase diagram. This is known as the critical point. Water has a critical point of 374°C. The temperature and pressure corresponding to this point are known as the critical temperature and critical pressure, respectively. The solid-liquid equilibrium line (m. p. line) slopes backwards (negative slope) rather than forward (positive slope). It means in the case of water; the melting point gets lower at higher pressures. At solid-liquid equilibrium, the ice is less dense than liquid water formed as it melts, and the water formed occupies a smaller space. At this equilibrium, if pressure is increased the equilibrium move to reduce the pressure again. That means it moves to the side with a smaller volume. To make the liquid water freeze again at this high pressure, we need to reduce the temperature. Higher pressure means a lower melting point.
The transition temperature (TUCT) of a system helps to determine the per cent purity of substances. The change in TUCT is proportional to the concentration of the substance added. For example, in the phenol-water system addition of sodium chloride or potassium chloride changes its TUCT depending upon the concentration of these substances. If known different concentration solutions of sodium chloride are prepared and added separately to phenol-water mixtures having composition say 50:50, then TUCT of the system is determined by plotting a phase diagram by taking concentrations of sodium chloride on the x-axis and UCT on the y-axis. An unknown solution of sodium chloride is then added to the phenol–water (50:50) system and again TUCT is determined. It is plotted on the curve to obtain its concentration by extrapolating on the x-axis. The TUCT is mostly used as a criterion to test the purity of substances that form a conjugate system with some other liquid.
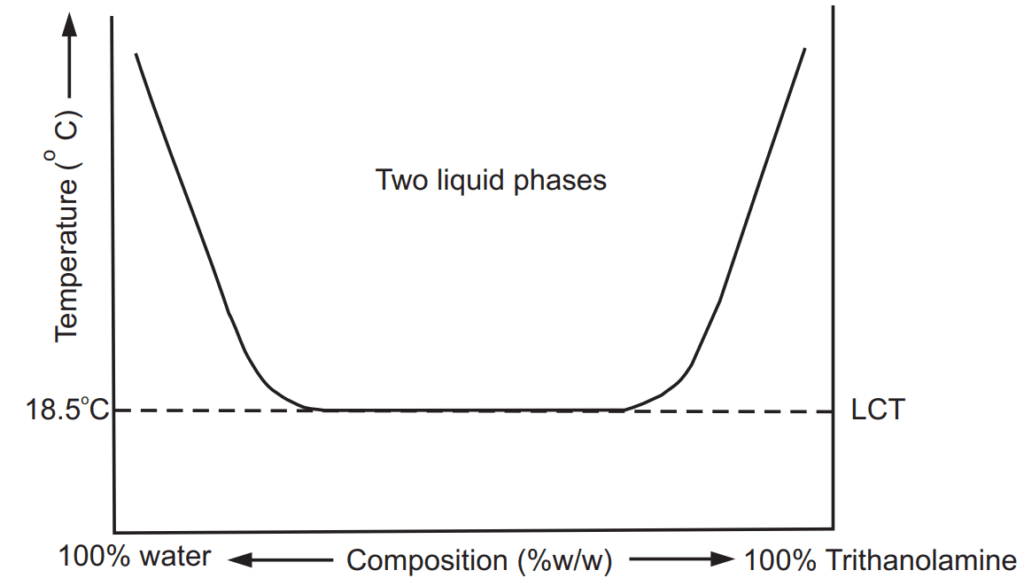
Phenol USP is a necrotic agent having a freezing point of 17ºC. Thus, at room temperature, it exists in solid crystalline form. The corrosive characteristic and solid nature of phenol make it difficult to handle. The Liquefied Phenol BP contains 80% w/w of phenol in water. The presence of other substances or impurities solidifies phenol approximately at about 10°C. The miscibility curve of the phenol-water system suggests that 76% w/w of phenol should be used in the preparation. At this concentration freezing point of phenol is 3.5°C. Such preparations remain in liquid form that can be handled easily. In India, we have a wide variety of climatic conditions with diverse temperatures ranging from 10 – 40°C during different seasons. Hence, a preparation which is in a dry powder state in winter or rainy season would become pasty during summer. The TUCT can also be used to determine the per cent compositions of each component in unknown mixtures. The temperature below which when system containing partially miscible liquids exist only as a single-phase is known as lower consolute temperature (TLCT). For example, the triethanolamine (TEA) – water system has a TLCT of about 18.5°C at 13% w/w of TEA. The temperature–concentration plot of this system is shown in Fig. 1.2. Above 18.5°C mixture of these liquids forms two layers. The left upward curve shows a decrease in miscibility of TEA in water whereas the right upward curve shows a decrease in miscibility of water in TEA with an increase in temperature of the system, respectively. At 50% by weight of TEA in water at 18.5°C forms a single phase. This temperature is called TLCT of TEA – water system. The region outside the curve shows mutual solubility of TEA and water in each other. Other examples of liquid pairs that show TLCT are dimethylamine – water (43°C, 13% w/w weight of dimethylamine), 1-methyl piperidine – water (48°C, 5% w/w of piperidine), polyethene glycol – water, paraldehyde – normal saline, water – Tween 80, etc.
Phenol and water are partially miscible liquids at room temperature. In this system, the addition of a small amount of phenol to water or water to phenol significantly changes relative volumes of two layers but not their compositions.
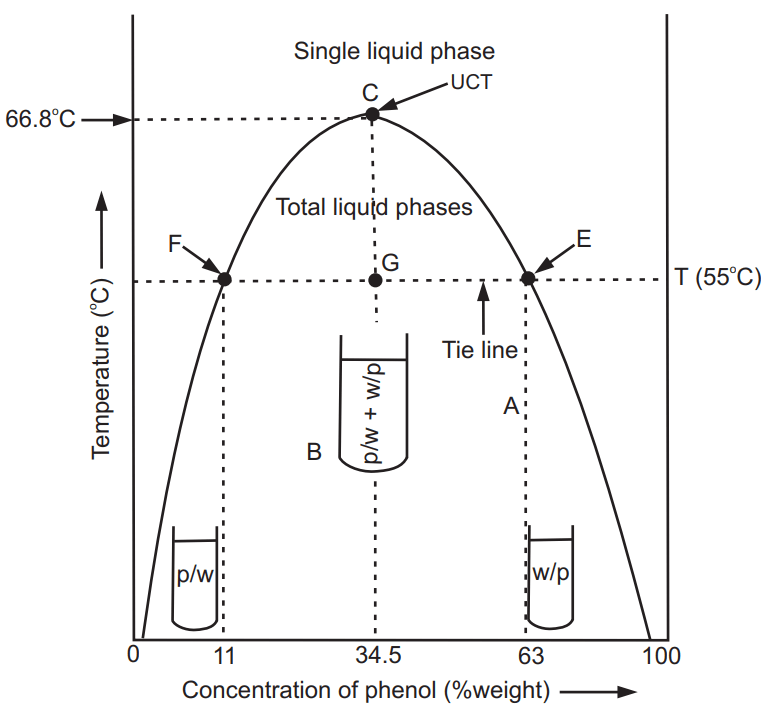
If the temperature is increased by keeping composition constant the mutual solubility of both the liquids increases and at a specific temperature they become completely miscible and two layers become one. Thus, at a specific temperature, the composition of both the components are fixed and both the liquids are miscible in all proportions with each other. The temperature at which two partially miscible liquids are in the state of one phase is known as critical solution temperature (CST) or upper consolute temperature (TUCT). This behaviour of critical solution temperature is shown by the phenol-water system as represented in Fig. 1.3. At any temperature (say T°C) the points F and C represent the composition of two layers in equilibrium with each other. The two solutions A (phenol in water) and B (water in phenol) are in equilibrium at a temperature is known as conjugate solution temperature. At this temperature two solutions of different concentrations exist in equilibrium with each other. The line in the phase diagram of phenol-water joining the points F and E is called a tie line. It is defined as the line which connects the compositions of the two layers in equilibrium on the phase diagrams of the system. At point C, the top of the dome-shaped curve, two layers become identical, resulting in the disappearance of the second layer to form a single phase. The temperature at which this happens is called as TUCT of phenol – water system. At any temperature above the TUCT both the liquids are completely miscible; whereas below this temperature, they exist in separate layers as individual entities.
Applications of Critical Solution Temperature
Basically, CST allows the temperature limits for some reactions to be determined if it requires that two liquids are miscible. An important application of the CST is to determine the water content in substances such as methyl and ethyl alcohols. Here the system is usually the alcohol and a hydrocarbon, such as -hexane or dicyclohexyl. The water is, insoluble in the hydrocarbon. Thus, the methyl alcohol-cyclohexane system has a CST of 45 – 50 °C and even the presence of 0.1 % water produces a rise of 0-15 °C in the CST. The concept of TLCT is helpful in the preparation of paraldehyde in saline. If during preparation solution of paraldehyde is cooled, rapid solution formation takes place. At room temperature, nicotine and water are miscible in all proportions with each other. As the temperature is raised the mutual solubility of these liquids decreases. Further, increase in temperature again at some higher temperature their mutual solubility increases. Nicotine – water system possesses both TUCT and TLCT of 208 °C at 32 % w/w and 61 °C at 22% w/w of nicotine, respectively. Above TUCT and below TLCT system exist as a single phase whereas at any temperature between them it exists as the two-phase system (partial miscibility). The solubility curves of these two liquids are shown as closed curves. Pressure has an effect on the nicotine-water system that increase in pressure increase TLCT and decreases TUCT. At a specific pressure and above, these partially miscible liquids are completely miscible in all proportions with each other at all the temperatures. Other systems that show TUCT, as well as TLCT, are glycerin and m-toluidine and β-picoline and water. The CST is affected by pressure and by the presence of impurities. Hence the CST may be taken as a criterion for the purity of a substance.
Make sure you also check our other amazing Article on : Partially Miscible Liquids