Dose-Response Relationship(DRC), When the relation between drug dose (X-axis) and drug response (Y-axis) is plotted on a linear scale, the resulting curve is usually hyperbolic. Clinical responses plotted in this manner include the change in heart rate, blood pressure, gastric pH, or blood glucose. Non-clinical (biochemical) responses can also be plotted; e.g. enzyme activity, accumulation of intracellular second messenger, membrane potential, or contraction of a muscle.
If the drug dose is plotted on a base 10 logarithmic scale, the generated curve is a sigmoidal dose-response curve (DRC). This representation is more useful because it expands the dose scale in the region where drug response is changing rapidly and compresses the scale at higher doses where large changes have little effect on response. In reality, it is ligand concentration (and resulting receptor occupation) that affects the response. The term DRC assumes that the drug dose and ligand concentration are closely related.
Basic Principles of Dose-Response Relationship
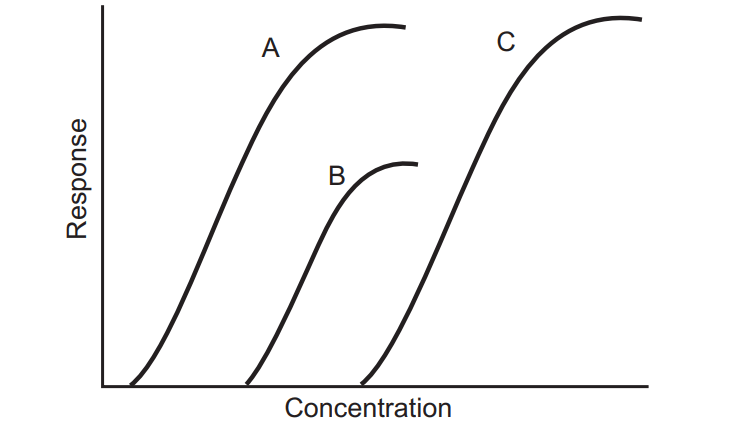
DRCs are a graphical representation of a specific functional reaction in a cell, tissue, or organism evoked by a range of doses of a given stimulus at a certain point in time. Stimuli can be internal or external, physical or chemical. In basic pharmacology, DRCs are used to calculate binding affinities for receptor-ligand interactions. Fig. 1.1 shows a hypothetical DRC, highlighting some important parameters which can be drawn from it.
DRCs typically have dose on the X-axis and response on the Y-axis. Plotting the logarithm of concentration generally results in sigmoidal plots as shown in Fig. 1.1. The main parameters which can be identified by DRCs are as follows:
- Potency: The position of the curve along the X-axis (Curve A).
- Maximal efficacy: The greatest response attainable (Curve B).
- Slope: Change in response per unit dose (and half maximal dose) (Curve C).
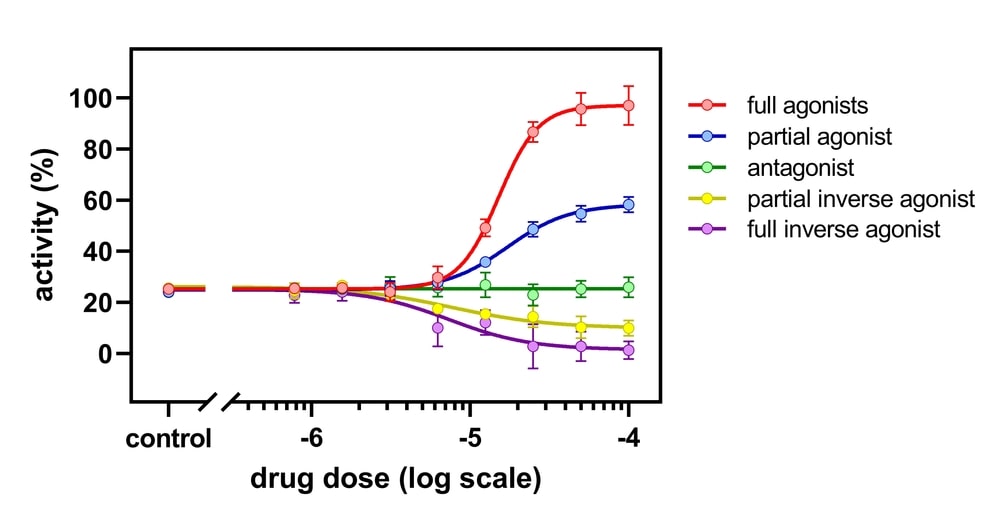
DRCs are more likely to be evaluating responses to drugs. Drug dose response involves the principles of pharmacokinetics and pharmacodynamics and can be used to determine the required dose and frequency to achieve the desired response. Multiple factors can cause variation in DRCs: population differences, patient-related factors, and measurement methodology. In view of biological variation, it is suggested to take repeated measurements under identical conditions to establish the pharmacological profile of the drug being evaluated. The dose-response relationship is important because the concentration of a drug at its site of action controls its effect.
A comparison between different types of DRCs is depicted in Fig. 1.2.
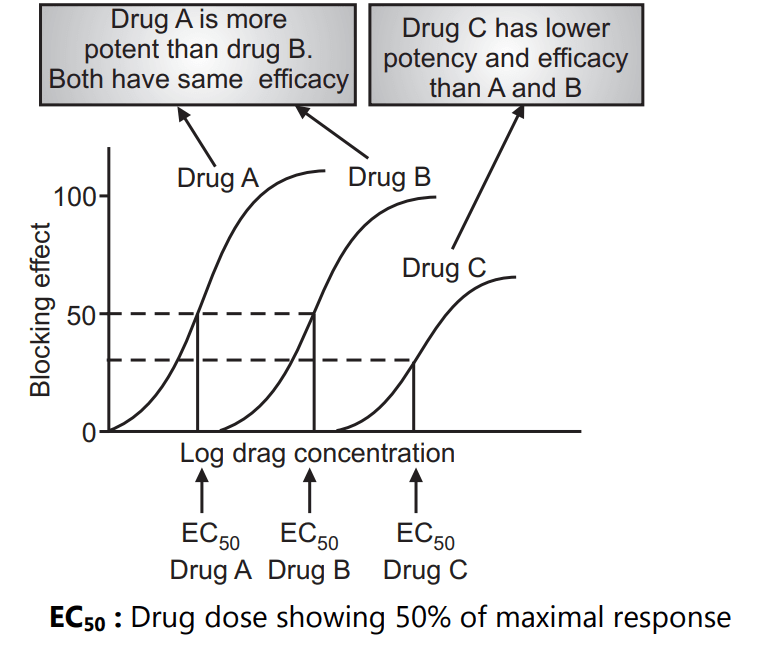
The pharmacologic profiles of individual drugs can be differentiated by comparing their DRCs. In Fig. 1.2, drug A has greater biological activity per dosing unit and is therefore considered to be more potent than drugs B or C- shown by its left-shifted position on the X-axis. Drugs A and C have equal efficacy- indicated by their maximal attainable response (ceiling effect); however drug C is less potent than A because it needs a higher concentration. Drug B is more potent than drug C, however, its maximal efficacy is lower.
Make sure you also check our other amazing Article on: JAK-STAT signalling pathway