An inventory shows the major current assets of a business enterprise. It means “In-house” or on the premises which is simply the result of buying. These are primarily maintained for the smooth running of business.
Table of Contents
Inventory Control:
Inventory means all the raw materials, spare parts, maintenance of consumables, semi-processed materials finished goods, etc. (a total of 30% investment is on inventory).
Inventory control is the supervision of supply, storage distribution, and accessibility of items in order to ensure an adequate supply without any excessive or inadequate inventories.
- It gives a delicate balance of cost versus profits associated with having stocks on hand.
- On average, a business has about 30% of its working capital tied up in inventories hence a business firm should maintain it in a proper manner for smooth running of the sales operation.
Importance of Inventory Control
- It provides and maintains good customer service.
- It enables a smooth flow of goods through the production process.
- It provides protection against the uncertainties of demand and supply.
- Various operations can be performed economically and independently.
- It ensures reasonable utilization of equipment and labor.
- At times a bulk discount can be availed.
Objectives of Inventory Control
Its main objective is to meet customer demand at the lowest possible cost with minimum investment.
Protection Against Fluctuations in Demand:
The demand forecast for any product can never be exact or accurate. There will be differences always in predicted demand and actual demand for the products. If sufficient items are available then fluctuations in demand can easily be adjusted.
Better Use of Man, Machines, and Materials:
In manufacturing systems, production planning can be done with an optimum use of resources like men, machines, and materials.
If they are kept engaged during the slack period there will be no need to generate additional resources in the boom period.
This leads to uniform and proper utilization of resources available.
Protection Against Fluctuations in Output:
It is important to reduce the gap between actual and scheduled production since it is adhered to by sudden breakdown of raw materials, power, machines, strikes, etc in such cases the difference in actual production and planned output can be bridged by inventories.
Control of Stock Volume:
Inventory control is concerned with the size and value of goods present in stock. It is responsible for forecasting the value which is helpful in the:
- Capital invested inventories do not exceed funds available.
- The amount invested is correctly recorded in account books.
- Protection against thefts.
Control of Stock Distribution:
Inventory is maintained due to
- Carry reserves in order to prevent stockouts or cost sales.
- To gain economies in purchasing by buying beyond the desired amount.
- Never have much of anything on hand etc.
Methods of Inventory Control:
The fundamental purpose of inventory analysis is to keep stock of items at such a level that there is a balance between the cost which increases or decreases with the size of the inventory.
The inventory control method needs to the determination of:
- Quantities that should be ordered each time.
- The time at which the order should be placed. So that both inventory cost and stock-out cost are kept minimum.
ABC Analysis
Or Always Better Control Analysis(Value Based):
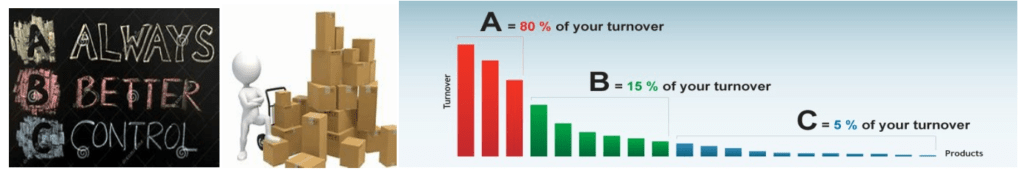
- It is based on the “Thick on best and thin on rest concept”.
- It is a method of classifying items or activities according to their relative importance based on Annual Sales Volume.
- It is an important tool used to identify items that need greater attention for control.
- Based on analysis classification they are grouped into 3 categories. i.e. A – Category B – Category C – Category.
A-CATEGORY: (Very Costly)
- The first 10-15% of the items account for approximately 70% of cumulative cost. Hence these items need more closure and careful control.
- They should be ordered frequently but in small size.
- A periodic review should be followed compulsorily. This results in enormous savings.
B-Category: (Medium Costly)
- The second 20-25% of the items account for approximately 15% of cumulative cost. They have an average usage value. These items are less important than A-class items.
- Statistical sampling is applied in their control.
C-Category: (Low Costly)
- The remaining 65-70% are C-category items and account mere 10% of the total value.
- These items can be stored at the operative place.
- They can be charged to an overhead account.
Limitation
This is based only on monetary value and rate of consumption. But in hospitals, any item of low monetary value and consumption may be vital or even life-saving.
Their importance cannot be overlooked simply because they do not appear in category “A”.
Vital Essential Desirable Analysis:
VED analysis is based on critical values. This analysis is applied to old brands which have greater requirements. This is based on criteria of availability and prize.
There could be serious functional dislocation of patient care services when these drugs are not available for a short period of time.
VED analysis is classified into:
- V – Stands for Vital.
- E – Stands for Essential.
- D – Stands for Desirable.
V – Category:
V – Category stands for survival of the patients and should always be available at all times in the hospital.
E – Category:
The items with lower critically needed are grouped in the category of “E”.
D – Category:
The remaining items with the lowest criticality and storage which would not be determinable to the health of patients are grouped in the “D” category.
With the help of VED systems, 89.52% of the inventories can be controlled.
Eg: Quinine is available as Quinine sulfate, Quinine hydrochloride, Quinine bisulfate, and Quinine ethyl carbonate. Out of which Quinine sulfate is vital (more demand). Quinine hydrochloride is essential (less demand) and Quinine ethyl carbonate is occasional (very less). Hence maximum inventory is kept on Quinine sulphate.
EOQ Analysis
Or Economic Ordering Quantity Analysis:
It refers to the size of the order and how much inventory is to be ordered at a time. In other words
Order quantity that minimizes total inventory holding costs and ordering costs. one of the oldest classical production scheduling models. The framework used to determine this order quantity is also known as the Barabas EQ Model or Barabas Formula.
Assumption
- Ordering cost constant.
- The rate of demand is known to spread evenly throughout the year.
- Lead time is fixed.
- The purchase price of an item is constant i.e. no discount
- Replenishment is made instantaneously
- The whole batch is delivered at once.
- Only one product is involved.
It is referred to as optimum or standard ordering quantity.
Here the two important categories of inventory costs are:
- Ordering costs.
- Carrying costs.
- Ordering costs are incurred on obtaining additional inventories i.e. communicating cost, ordering cost, transport cost, etc.
- Carrying cost represents the cost incurred on holding inventory on hand i.e. cost of money held up in inventories, storage spoilage, etc. Hence if we minimize carrying costs we have to place small orders which increase ordering costs and if we want to minimize ordering costs we have to place large orders which in turn increase total costs.
EOQ helps in getting balanced orders. This is done by:
- Tabular determination of EOQ.
- Graphic presentation of EOQ.
- Determination of EOQ by algebraic method.
a) Tabular Determination of EOQ:
The tabular arrangement of data related to items helps the company to find the number of orders needed to be placed weekly, quarterly, monthly, or yearly.
b) Graphic Presentation of EOQ:
If a graph is plotted between order quantity and cost to order and carry. The ideal order size is the point where the sum of both costs is minimal.
c) Determination Of EOQ By Algebraic Method:
This can be done by using the formula
EOQ = Square root of 2ab/cs
Where,
a=annual consumption.
B = Buying cost per order.
C=cost per unit of material.
S = storage and other inventory carrying costs.
Eg:
Annual usage of material = 1200 units.
Cost = 10. Prize per unit = 1.
Carrying cost = 24% per year
Then EOQ = square root of 2*1200*10/1.00*0.24 = 316 units.
Lead Time:
- This is the time gap between the placement of an order and the time of actual supply
- Lead time = servicing time + delivery time + receiving time.
- In business, inventory cannot be instantly replenished hence in order to guarantee the frequency of stockouts. The demand will be consumed between now and the next replenishment.
- The longer the lead time the
- This is mainly composed of three components. They are:
a) Servicing Time:
It is the time taken to place the order. It includes:
- Time for obtaining quotations.
- Time to negotiate the price.
- Time for visiting potential suppliers
- Time to let contracts
b) Delivery Time:
It is the time taken by the supplier to comply with certain orders.
c) Receiving Time:
This includes:
- Time for uncrating
- Time for inspection of goods.
- Time for movement of goods to stores.
- Time for entry of goods in stocks.
Safety Stock or Buffer Stock:
- Safety stock is the stock held by a firm in excess to mitigate the risk of stockouts due to uncertainties in supply and demand.
- The formula is Safety stock = (maximum daily usage – average daily usage) * lead time.
- This is mainly maintained or carried in the pharmacy when there is no surety about either the demand for drugs or lead time or both of them.
- Factors affecting safety stock are:
- Uncertainty in demand.
- Uncertainty in lead time.
- Size of the batch.
Eg: the lead time for a medical store is 2 days i.e. stock arrival
Maximum daily usage – 10 bottles.
Average daily usage – 7 bottles.
Excess – 3 bottles.
Lead time – * 2 days.
Safety stock – 6 bottles.
Calculations of Retail Price of Formulations:
RP = (MC+CC+PM+PC) * (1+MAPE/100) + ED.
RP = Mean retail price.
MC = material cost includes the cost of drugs and other aids.
CC = conversion cost worked out in accordance with norms.
PM = cost of packing material including process loss.
PC = packing charges worked out in accordance with the government.
MAPE = maximum allowable post-manufacturing expenses. It should not exceed 75% in Category I and 100% in Category II.
ED = excise duty.
Insurance Formula:
1-2% as representative percentage, total inventory cost around 20%
E.g.: Average stock in year 60,000, inventory costs 20% then 60,000*20/1000=Rs 12,000.
The margin of Safety:
Total sales minus the sales at the break-even point are known as the margin of safety.
The margin of safety = Total sales-sakes at breakeven point.
As percentage=margin of safety/total sales*100.
Formula For Maximum Quantity Storage: (At Godown)
Maximum level=Re-order level + re-order quantity –(maximum consumption*minimum re-order period).
Minimum Level of Storage:
Minimum level=Re-order level-Average rate of consumption*average time required to obtain fresh delivery.
Re-Order Level or Ordering Level:
Re-order level=maximum re-order period*maximum usage.
Average Stock Level:
Average stock level=1/2 (maximum level + minimum level). Or minimum stock level+1/2 (re-ordering quantity).
Gross Profit Ratio:
GRP = Gross profit/Net sales*100.
Material Consumed Ratio:
Materials consumed/Net sales*100.
Convention Cost Ratio:
Labor expenses manufacturing expenses/Net sales*100.
Return Of Capital Employed:
Net profit/Capital employed*100.
Return On Total Assets:
Net profit after tax/Total assets*100.
Make sure you also check our other amazing Article on: Dispensing of Drugs to Ambulatory Patients