
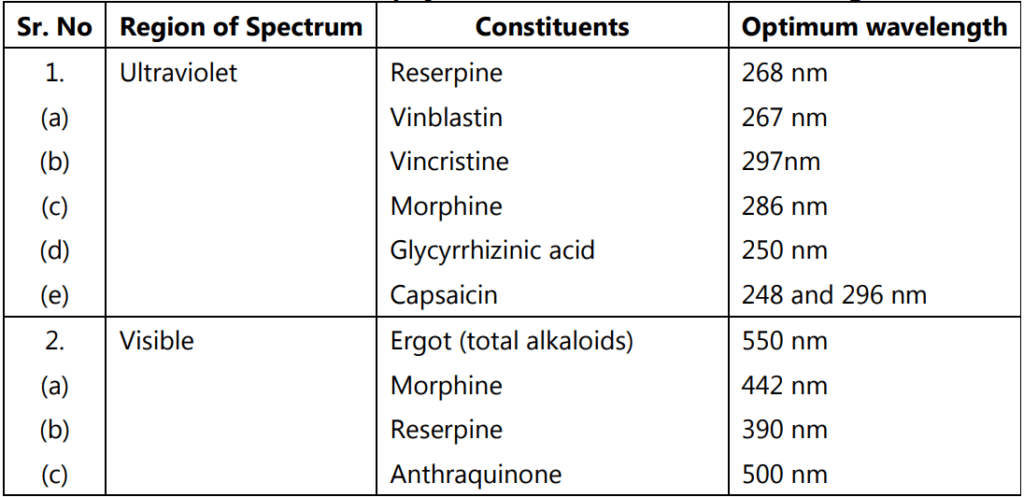
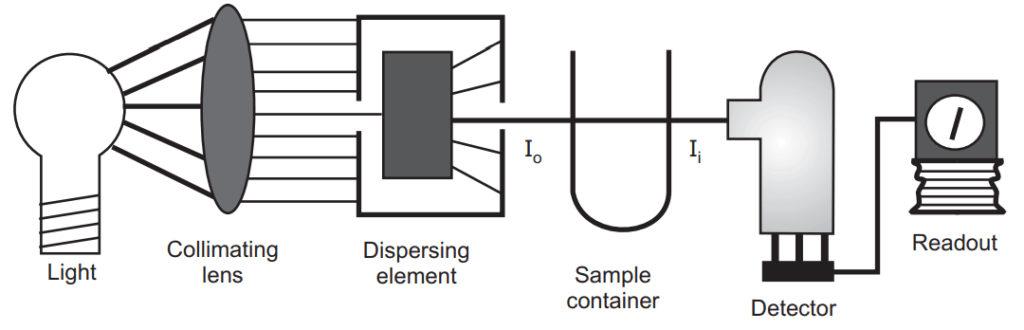
UV spectroscopy plays a very important role in the identification of plant constituents. This may be either in the screening of crude plant extract or observation of the eluents of the chromatographic column during the separation of plant products. Generally, the UV spectroscopy of the phytoconstituents should be measured in dilute solution using an appropriate blank. The absorbance of colored compounds can be measured in between 200 to 700nm while the colorless compound can be measured in between 400-700nm. The particular wavelength at which the maximum and minimum absorption take place should be recorded. A pure phytoconstituent which shows the characteristic UV spectra should be purified repeatedly from the mixture until the particular characteristic spectra will be obtained with the help of UV visible spectra. Sometimes we can also predict the structure of phytoconstituents like carotenoids have generally three small absorption peaks in the region 400-500nm.
If a single peak persists between 250-260nm the phytoconstituents may be purine aromatic amino acids phenol or pyrimidine polyacetylenes (unsaturated compounds). Hydroxyl cinnamic acid (aromatic compound) and ketones have also shown the characteristic UV absorption pattern. The BP gives an identification test of various phytoconstituents based on their UV absorption characteristics like lanatoside C, benzylpenicillin, and various alkaloids (i.e. morphine, cocaine, reserpine, tubocurarine chloride, and colchicine). It is also useful for the quantitative evaluation of the phytoconstituents. For this first, the standard curve is prepared by using the standard substance, and then by this curve, the concentration of the unknown compound is determined.
Infrared Spectroscopy
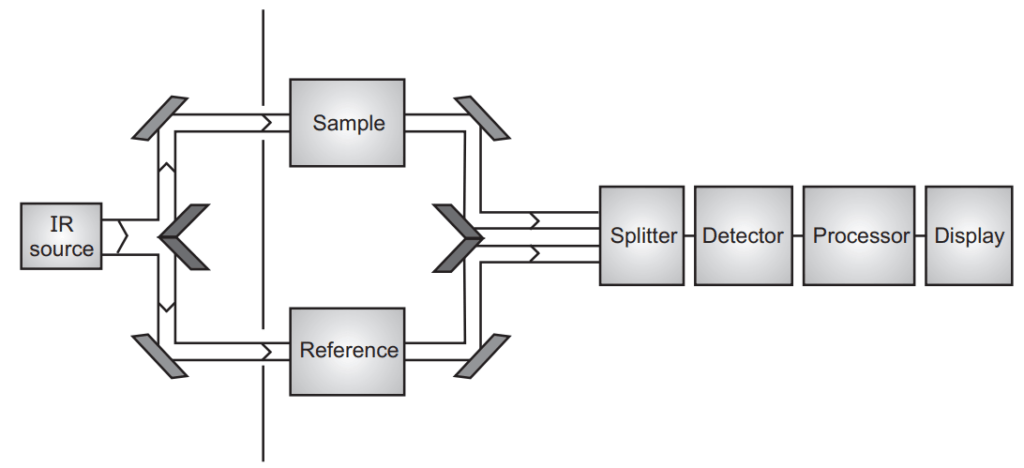
In the infrared region, the energy involved in the absorption is very small and the spectrum in this region is much more complex. The energy associated with absorption is so small that it will not produce electronic transition but enough to produce rotational and vibrational energy changes. The spectrum of infrared can be divided into two regions. The first one is the Fingerprint region (7-11µm) and another one is the functional group region.
In the fingerprint region, it is difficult to assign the peak but can assign the peak in the functional group region. The intensity of the band can be recorded as (S) strong (M) medium (W) or weak.
With the help of characteristic vibrational frequencies, we can assign the various functional groups in the molecule (mentioned in the table). We can compare the natural phytoconstituents to the synthetic compounds by comparing the fingerprint region. IR spectra are most commonly used to identify known essential oil components which are separated by gas-liquid chromatography (GLC).
IR spectroscopy is a great tool in the structure elucidation of a new phytoconstituent isolated from the natural origin. The interpretation of the spectrum of the new compound is very complex and needs very experience. With the help of IR spectroscopy, we can also perform the quantitative analysis of a crude herbal sample or their formulation. In the quantitative analysis, the area of the peak of the band are measured and the ratio of the area of two samples is compared by the help of which we can assign the percentage of pure drug or the herbal drug present in the formulation.
| Sr. No. | Compounds | Approx positions of characteristic bands above 1200 cm−1 |
| 1. | Alkanes | 2940 (S), 2860 (M), 1455 (S), 1380 (M) |
| 2. | Alkenes | 3050 (W-M), 1850 (W), 1650 (W-M), 1410 (W) |
| 3. | Aromatics | 3050 (W-M), 2100-1700 (W), 1600, 1580, 1500 (W-M) |
| 4. | Acetylenes | 3310 (M), 2225 (W), 2150 (W-M), 1300 (W) |
| 5. | Alcohols and Phenols | 3610 (W-M), 3600-2400 (broad), 1410 (M) |
| 6. | Aldehydes and Ketones | 2750 (W), 2680 (W), 1820-1650 (S), 1420 (W-M) |
| 7. | Esters and Lactones | 1820-1680 (S) |
| 8. | Carboxylic acids | 3520 (W), 3400-2500 (broad, M), 1760 (S), 1710 (S) |
| 9. | Cyanides | 2225 (W-S) |
| 10. | Isocyanates | 2270 (VS) |
Mass Spectroscopy
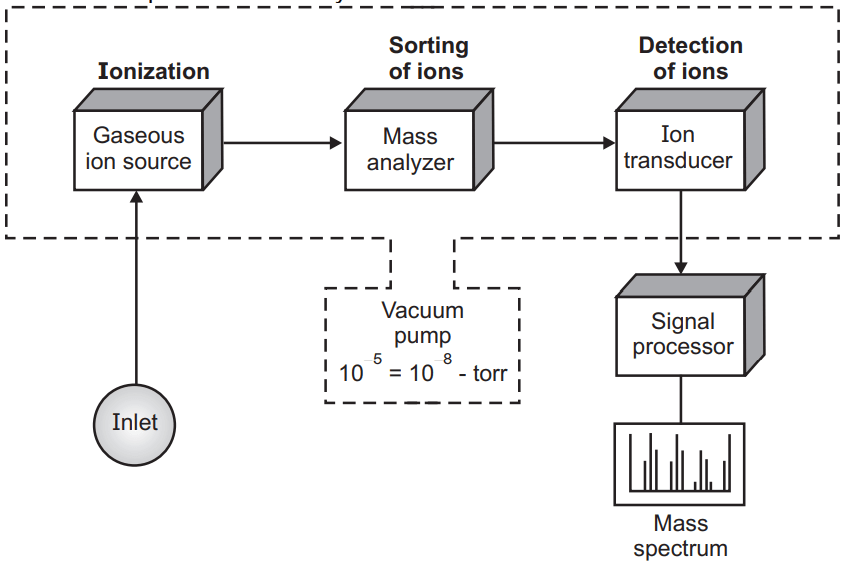
With the help of mass spectroscopy, we can get the accurate molecular weight of the phytoconstituent by using only the microgram quantity of the sample. Mass spectroscopy produces the characteristic fragmentation pattern which is helpful to identify the phytoconstituents.
The microgram amount of phytoconstituents is introduced into the mass spectrometer where the compound becomes ionized and causes fragmentation of the chemical bonds. Mass spectra are the graph in-between the relative proportion of a fragmented ion versus the ratio of mass/charge of these ions.
Mass spectroscopy nowadays is very useful to get the information of about the structure of unknown phytoconstituent. Nowadays mass spectra is attached to the high-performance liquid chromatography (HPLC) were isolated constituent direct entry into the mass spectra and help the identification of the unknown phytoconstituents.
A mass spectrometer is a very complicated and sophisticated instrument and unlike the UV and IR where the instrument is operated by an individual phytochemist, it is operated by some technical expert person. The mass spectroscopy is also useful to very low molecular weight phytoconstituents. In general, the mass spectroscopy is used for the structure elucidation of phytoconstituents but sometimes when two mass spectrometers are attached simultaneously it is also useful for the quantitative analysis.
Nuclear Magnetic Resonance (NMR) Spectroscopy
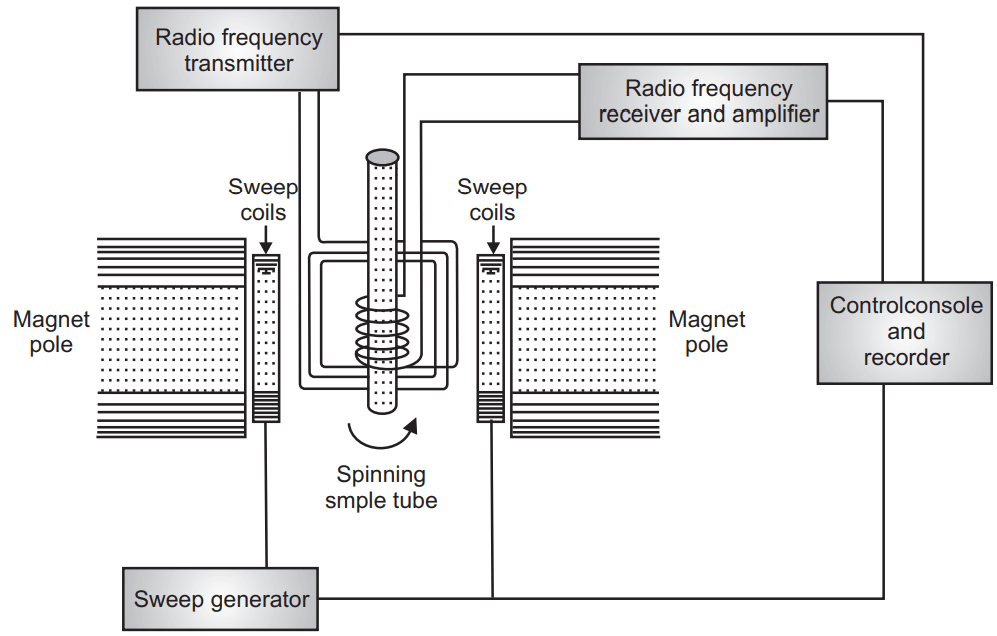
In the nuclear magnetic resonance (NMR) spectroscopy when we apply radio frequency energy under the presence of a magnetic field there is a change of spin at the nuclear level. Generally, we study hydrogen or proton and thus NMR is called as proton magnetic resonance (PMR). When 13C, 35Cl, 19F, and other nuclei are studied it is known as NMR. Nuclei with the only odd mass number only give NMR spectra.
Generally the proton with uneven mass number spin on their own axis and when the energy is applied to it in the form of radio frequency under a magnetic field at the particular precessional frequency it absorbs the energy and gives the NMR signal. The nucleus after absorbing this energy moves from the ground state to the excited state and spin in reversal or anti-parallel orientation. The nucleus comes back to the ground state when the externally applied radio frequency is stopped. Generally the graph plot in the form of chemical shift and it is represented by δ–value which is from 0-10 δ for most compounds. Each proton or hydrogen atom in the organic molecule feels a different environment due to the nearness of heteroatom, double bond or triple bond, aromatic, alicyclic or benzene ring and each proton needs different energy for its excitation. Therefore the each proton give a different peak of signal due to their different environmental surrounding there. The chemical shift is the difference between the absorption peak of the sample and the absorption peak of the reference compound. The reference compound is generally TMS (Tetramethyl silane). Generally, the sample is kept into the solution with inert solvent in between the pole of a powerful magnet. The major importance of Proton NMR comes under the structure elucidation of phytoconstituents. The more different types of protons present in the molecule will produce a more complex spectrum. So highly substituted alkaloids give the fewer signal. Due to interaction between proton attached to adjacent carbon atom the spectral signal may be doublet or triplet compared to a single peak. Thus more skill is required for the interpretation of NMR spectra. Though the quantity requires in mg in NMR but it is recoverable compared to mass spectroscopy.
Make sure you also check our other amazing Article on : Gas Liquid Chromatography