Aim: To determine the average particle size and find out their distribution pattern (by sieve analysis) of the supplied granular sample.
Principle: A sieve is a perforated screen and the size of the opening depends on the number of meshes and the diameter of the wire constituting the mesh. The particles sufficiently small will pass through and those that are oversize will be retained on the sieve. A sieve will classify the particles as less than the dimension of mesh (undersize) and more than the dimension of mesh (oversize).
When a powder sample is passed through a set of around 5 sieves arranged with descending aperture size (coarsest sieve at the top); the weight remaining on each sieve quantifies the oversize particles. The particle size analysis through sieving is best expressed in the form of a cumulative oversize, cumulative undersize, or a histogram.
Unlike microscopy, in sieving, the distribution is expressed on a weight basis (weight diameter).
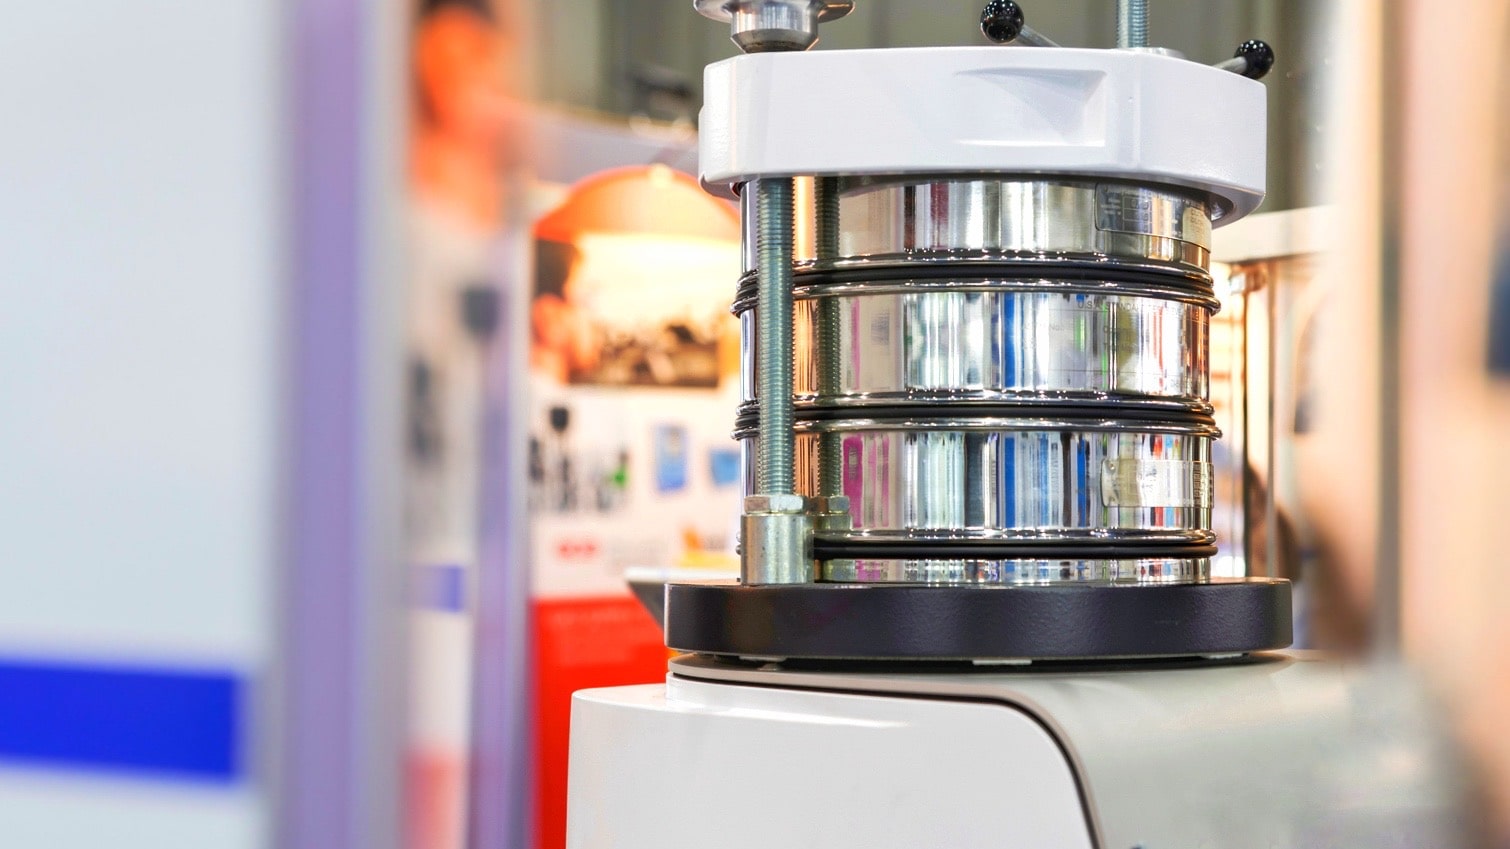
Materials and apparatus required: Granular sample, Series of sieves, Mechanical sieve shaker.
Particle size distribution by sieving method
- About 5 sieves are arranged to keep one above the other in a series with the coarsest (less No) at the top and the finest at the bottom.
- Around 100 grams of pre-weighed sample is placed on the top sieve.
- The nest of sieves is shaken for about 20 minutes preferably in a sieve shaker.
- The quantity of sample retained on each sieve is weighed.
- The average particle size is determined as a weight fraction and the distribution is expressed in a cumulative over-size curve.
Observation and Calculation:
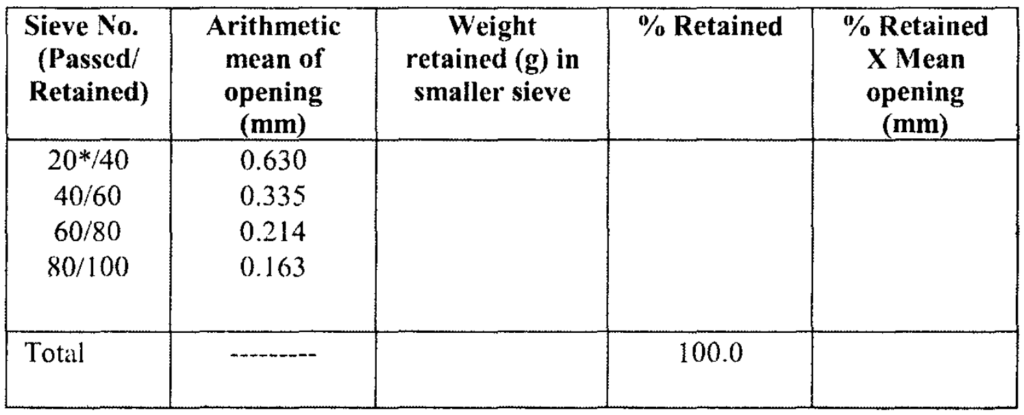
* Assumed that no particle is retained in no. 20 sieve, all passed through.
The\;average\;diameter\;=\;\;\frac{\sum(\%\;retained\;x\;mean\;opening)}{100}=\;\mu m
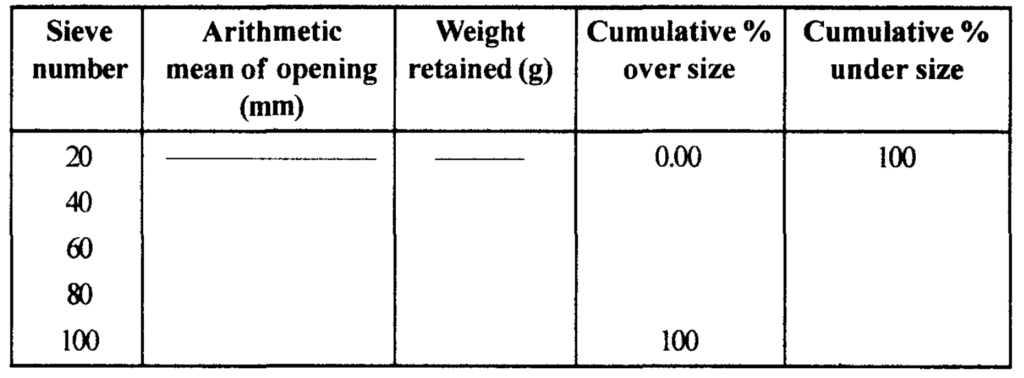
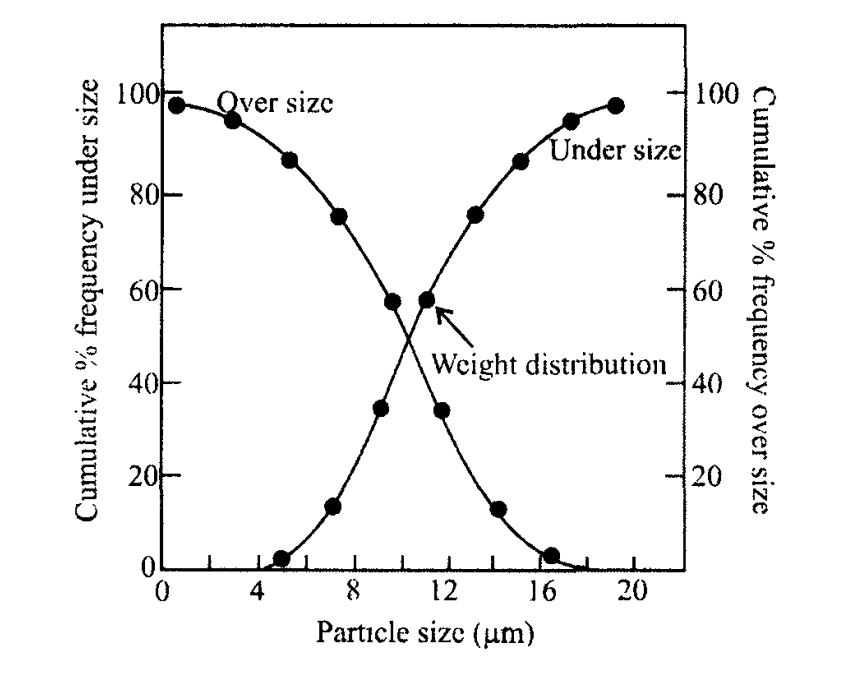
The particle size weight distribution can best be expressed either as cumulative oversize or cumulative undersize.
Report: The average diameter of the particles of the sample is mm (Weight diameter). The distribution pattern is shown in the figure as cumulative oversize and cumulative undersize.
Make sure you also check our other amazing Article on: Determination of Particle Size and Size Distribution by Microscopy